FRAMBuilder
Background and purpose
Considerable processing is required to translate coded-wire tag (CWT)
data from the Regional Mark Processing Center’s (RMPC) Regional Mark
Information System (RMIS) database into meaningful units within a FRAM
base period (BP) calibration context. Individual tag groups must be
associated with a specific FRAM model stock, and tag recoveries at a
particular time, location (indicated by RMIS location code), gear type
must be mapped to one of FRAM’s fisheries and time steps. The
FRAMBuilder program and workflow described here was developed to fulfill
these needs, among others.
Early in the development of FRAMBuilder and the overall CWT mapping
workflow, the base period workgroup (BPW) identified distinct
advantages/benefits to leveraging the Pacific Salmon Commission’s
Chinook Technical Committee’s (CTC) CWT analysis tools: the Cohort
Analysis System (CAS) mapping program and companion database. The BPW
ultimately decided to tie FRAMBuilder to the CTC world because this
connection: (1) allows for the seamless integration of CTC ‘Auxiliary’
CWT files, agency-supplied/prepared files that supplement or correct
known errors/gaps in RMIS’s CWT recovery information; (2) facilitates
the efficient inclusion of screened/vetted CWT release groups (i.e.,
selected by CTC members with regional expertise) into the calibration
database; and (3) increases the overlap in information driving models
supporting the management decisions of the PSC, the Pacific Fishery
Management Council (PFMC), and state–tribal co-managers. Additionally,
given partial overlap in the fishery assessment units used by the CTC
and in FRAM, the integration of CAS into the FRAM calibration workflow
offered efficiency in the form of an initial stage of RMIS-to-FRAM
mapping.
The following provides - a roadmap of the process from raw RMIS CWT
release/recovery data to something useable in a FRAM calibration - basic
documentation on the structure/function of the FRAMBuilder program, its
companion FRAM-CAS database, and the ruleset it follows to get CWT
recoveries from the initial CAS stage of mapping to a final FRAM
fishery/time step state. As for the tools ‘borrowed’ from the CTC (i.e.,
CAS.exe), we provide only a brief sketch here and refer the reader to
CTC resources for further documentation.
Overview
The procedures to map an individual CWT recovery to a FRAM stock and
fishery are conceptually straightforward: in screening candidate codes,
make a determination regarding which tags are suitable representatives
for model stocks, and then, given recovery details such as RMIS location
codes, gear codes, dates, etc., make a determination regarding the model
fishery/time step to which the recovery belongs.
In practice, however, this task is made difficult by the thousands of
tag codes representing unique hatchery release groups that are available
for consideration. This means that the hundreds of thousands of
individual tag recoveries from these groups must all be mapped from the
thousands of unique time-location-gear code combinations to one of
FRAM’s fisheries. The FRAMBuilder workflow addresses this challenge via
to the following steps:
- Select tag groups.
- Query RMIS for release/recovery data.
- Load RMIS query results into the CTC Filter database, and query it
to create CAS input files.
- Load tags into CAS (i.e., stage 1 of mapping – to CTC fishery
strata).
- Run FRAMBuilder (i.e., map/process recoveries).
- Export data for any necessary post-FRAMBuilder processing to create
calibration input files.
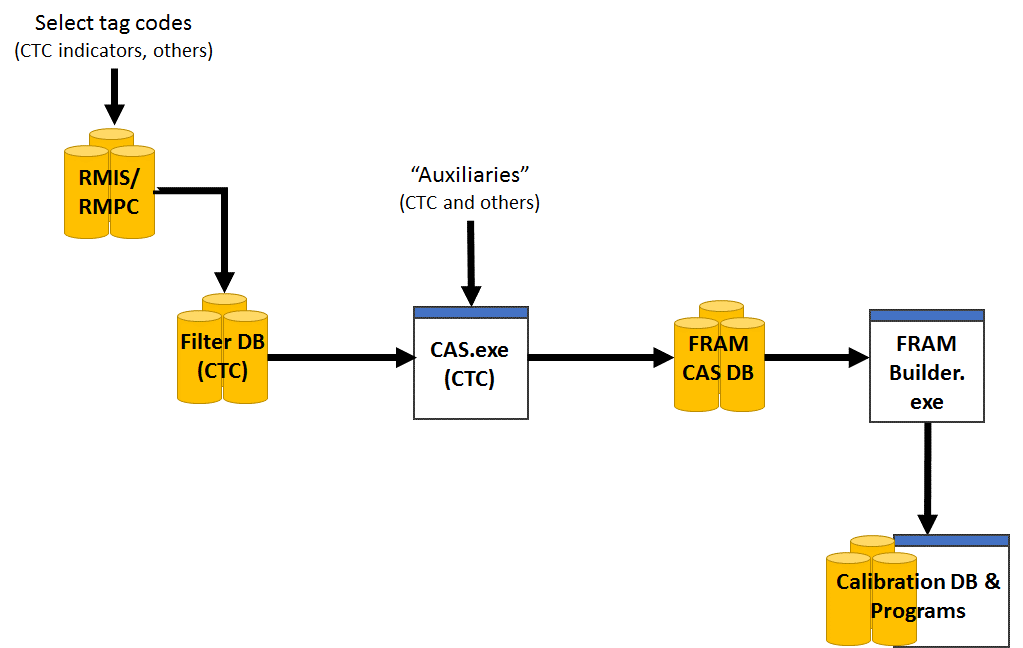
In addition to these steps, a handful of other functions can be
invoked during step 5, depending on a user’s needs. These are also
described further below. The remainder of this document is organized
around each of these steps, where each subsection offers both ‘how to’
details and documentation on processing decisions, algorithms, etc.
where necessary.
Required programs and data files
Data files
- A list of tag codes: A list of tag codes is needed for the purposes
of querying RMIS (release/recovery), as well as for populating the CTC
Filter database’s ‘STKCDS’ table.
- CWT release data: These are the raw release details for the chosen
codes, acquired from RMIS via a ‘Tagged Releases’ query; query results
are downloaded as a CSV, with the headings specified under Step 2
below.
- CWT recovery data: These are the raw recovery details for the
selected codes, acquired from RMIS via a ‘Recoveries By Tag Code’ query;
query results are downloaded as a CSV, with the headings specified under
Step 2 below.
- Auxiliary files (or ‘auxiliaries’): These are text files (.csv
or .txt), prepared by CTC members from a variety of
agencies/jurisdictions, that contain supplementary CWT recovery
information that is meant to augment (or revise) the CWT information
acquired from RMIS for some stocks; these files are typically created on
a stock/code basis and are necessary to ensure the calibration process
includes the most accurate information. For example, CWT recoveries in
escapement—a major anchor point for the type of backwards cohort
reconstruction underlying FRAM calibration—are not available via RMIS
for many Canadian stocks.
Microsoft Access Databases
- The CTC’s Filter Database: This is a Microsoft Access database into
which the RMIS release/recovery query results (above), combined with a
tag list (‘STKCDS’) are loaded. Using two custom queries, this database
returns RELEASES.txt and RECOVERIES.txt files which can be imported
directly to the FRAM-CAS database.
- A FRAM-modified CAS database (FRAM-CAS hereafter): This Access
database is an adaptation of the CTC CAS database (final preseason 2019
version), which includes several tables (and added fields to existing
tables) designed to (1) cross-walk CTC fishery strata to FRAM fisheries
or (2) to house/contain mapped outputs for direct export/use in CAS.
(The FRAM-CAS fishery crosswalk adheres strictly to the CTC’s ‘fine
scale’ fishery strata from 2019; any attempt to create an updated
FRAM-CAS database will require an updated FRAM to CTC crosswalk
(database table ‘FRAM_Fishery’). Versions of FRAMBuilder databases and
outputs created prior to 2019 were based on the final preseason CTC CAS
database from 2013 and the ‘fine scale’ fishery strata contained
therein.)
Programs & companion files
- FRAMBuilder 2.0: Because FRAMBuilder is very much an interactive
program subject to ad hoc changes/revisions to fulfill the BP team’s
evolving needs, it hasn’t yet been developed into a distributed, fully
compiled .exe file (i.e., ‘production mode’). Thus, the ‘program’ is
actually a Microsoft Visual Studio solution (.sln) file that is operated
within the development environment (i.e., Visual Studio, version 2008+).
The code base and history of modifications can be found at: https://github.com/jon-carey/FRAMBuilder.
- The CTC’s CAS (and dll): CAS_1.9.exe and CASLib.dll (2019 versions;
Versions of FRAMBuilder databases and output created prior to 2019 used
the 2013 version of CAS: CAS1.5_No_Restrictions.exe)
- Visual Studio, version 2008+: To operate FRAMBuilder ‘in the
environment’ you will need a compiler; Visual Studio Express for
desktops is a good free option (if Professional isn’t on your list of
programs).
- Others: Although they aren’t tied explicitly to the mapping
procedures outlined here, there are both R and OpenBUGS programs that
estimate parameters for growth functions from CWT length observations
(i.e., mapped to FRAM fishery and size limit regulation) summarized by
FRAMBuilder. Jon Carey also has an R program (and input template/files)
that estimates missing recoveries for freshwater sport (Puget Sound,
Willapa Bay tribs) and estuary sport (Willapa Bay).
Main workflow
Select tag groups
The full rationale surrounding the final decisions to include/exclude
tag codes is beyond the scope of this document, but the basic selection
guidelines are as follows.
Preference was given to CWT codes associated with CTC ER indicator
stocks, as these have already been screened by CTC members with regional
expertise and deemed to best represent natural and hatchery Chinook
stocks within their jurisdiction.
For stocks/regions beyond the CTC’s scope, selection was guided by
the following criteria/considerations:
- For nearly all stocks, tag selection was limited to brood
years (BY) 2005-2008
- additional brood years were included for special calibration
analyses (e.g., out-of-base procedures relied on brood years 2002-2004,
growth functions)
- due to the ‘collapse years’, Sacramento/Central Valley fall Chinook
include 2009 brood releases and omit 2005-06 broods
- Only stocks belonging to the ‘5000’ series of marks (i.e.,
adipose-fin clipped) were included; unmarked fish could not be used due
to their absence in (1) CWT samples for visually sampled fisheries and
(2) mark-selective fishery catches.
- CWT release groups were generally avoided
- from ‘experimental’ production groups (e.g., novel stock
crosses),
- with questionable warning flags (e.g., BKD outbreak),
- that were released at stages earlier than the fingerling stage,
and/or
- that were released at locations with difficult/poor escapement
enumeration (e.g., acclimation ponds).
For further detail on codes selected for particular stocks, please
refer to the Chinook FRAM stock profile spreadsheet, available for
download at: https://github.com/jon-carey/FRAMBuilder.
Query RMIS for release/recovery data
Given a set of codes, the next task is to query RMIS for the
necessary release and recovery information. The online system requires a
user account and can be accessed by visiting https://www.rmpc.org and
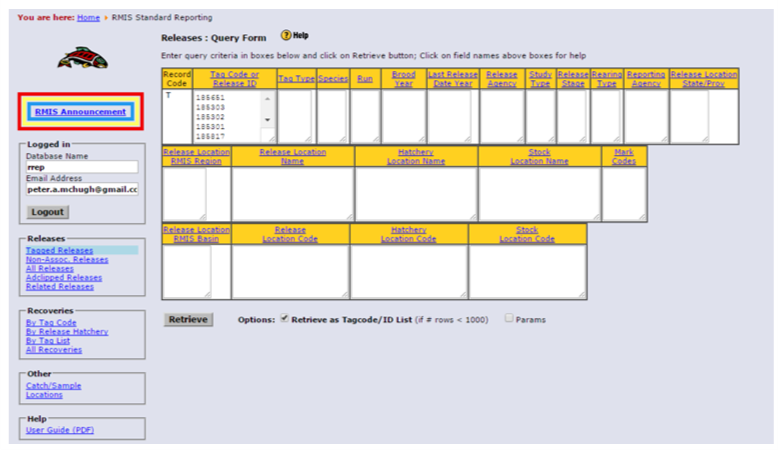
selecting ‘RMIS Standard Reporting.’ Release data are acquired via the
‘Releases: Tagged Releases’ query form, which requires your tag list.
When pasting in your list of tag codes, it is important to ensure that
any leading zeros are maintained, otherwise the system will not
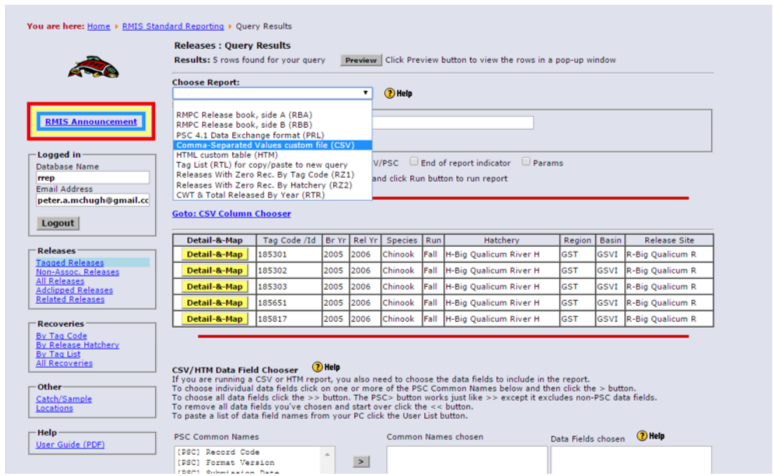
recognize the tag codes. After entering the list of tags and clicking
‘Retrieve’, you’ll have to choose the type of report (CSV via email is
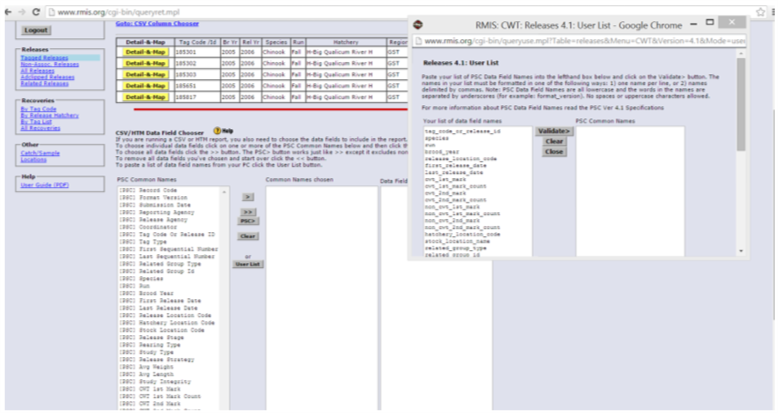
preferred) and specify the fields returned in the query results. Loading
the Filter Database requires a specific User List of fields (copy/paste
the list from here):
tag_code_or_release_id species run brood_year release_location_code
first_release_date last_release_date cwt_1st_mark cwt_1st_mark_count
cwt_2nd_mark cwt_2nd_mark_count non_cwt_1st_mark non_cwt_1st_mark_count
non_cwt_2nd_mark non_cwt_2nd_mark_count hatchery_location_code
stock_location_name related_group_type related_group_id
Upon validating the user list and clicking the ‘Run’ button, results
will be returned to your screen/email.
These should be saved for importing to the Filter Database,
preferably programmatically (i.e., via a call to a suitable tool such as
readr::read_csv("report_url_from_RMIS_email.csv"))).
The steps to run the custom ‘Releases: Tagged Releases’ query are now
repeated for the ‘Recoveries: By Tag Code’ query, but with a custom User
List of the following fields:
recovery_id recovery_date period_type period species sex length
length_code tag_code tag_status estimation_level recovery_location_code
fishery estimated_number sample_type run_year recorded_mark
catch_sample_id detection_method sampled_maturity reporting_agency
adclip_selective_fishery
Query results can now be saved as a CSV imported into the Filter
Database. Be careful when opening/viewing these query results before
importing into Filter Database; CSVs open readily in Excel and can be
unintentionally reformatted upon opening (e.g., text to numeric will
drop leading zeros on some codes).
Filter RMIS data for importing to CAS
The release and recovery CSV files constructed in Step 2 can now be
imported directly into the Filter Database. This is achieved via the
Microsoft Access functions under External Data > Import & Link
> Text File. This allows you to specify the appropriate Releases.CSV
or Recoveries.CSV file in the ‘File Name field’ (browse and point to
accordingly) and append records to the appropriate database table
(RELEASES or RECOVERIES). To minimize potential error, it is generally
advisable to start with a clean Filter Database for these steps.
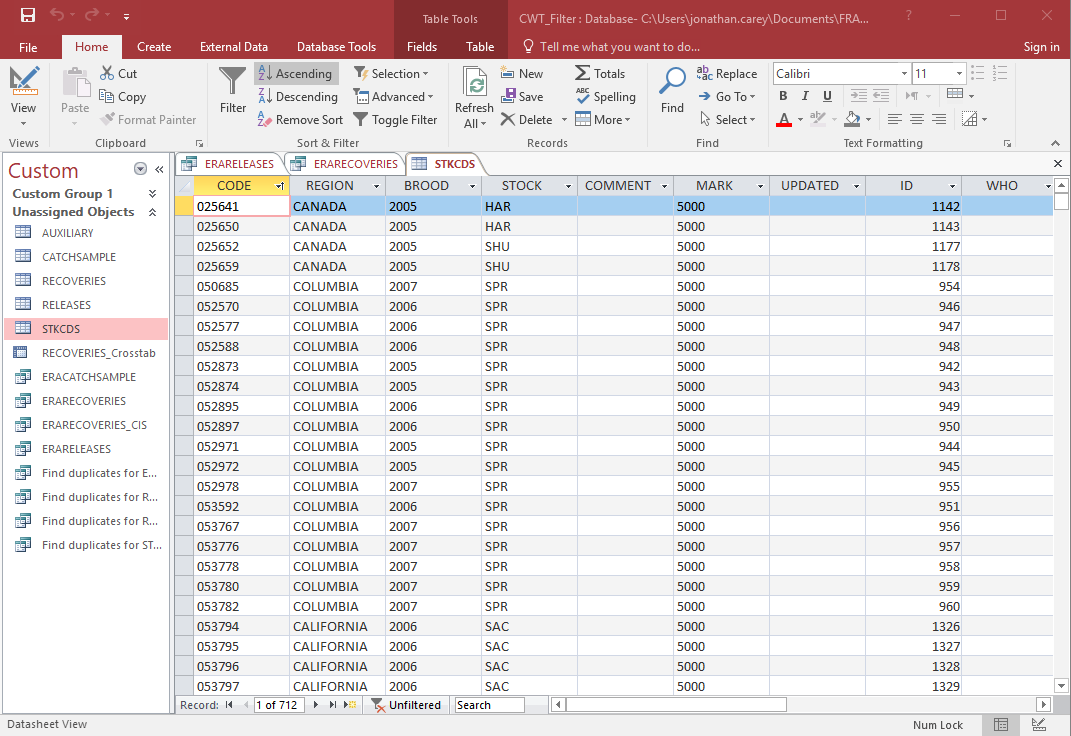
After loading RMIS query results, the Filter Database’s ‘STKCDS’
table (Figure 6.1) must be populated with the tag codes contained in the
release and recovery datasets. The three letter abbreviations in the
STOCK field must follow existing conventions (i.e., be in the CAS
‘SpeciesStock’ table), otherwise records will be rejected [Note:
although all FRAM stocks are already covered, new stocks can be added
via steps contained in CTC CAS help files].
After the Filter Database is loaded with necessary content, these
data are ‘filtered’ via two queries (releases, recoveries) that are
saved as .txt files for import into CAS. The ‘ERARECOVERIES’ filter
query eliminates 1. recovery observations that cannot be used in a
quantitative analysis (i.e., RMPC ‘sample type’ = 5), 2. high seas
fishery recoveries,
3. some recoveries that are dealt with as auxiliaries (e.g., Canadian
escapements), 4. the handful of recoveries in Alaska that occur outside
of Southeast (i.e., location codes for all recoveries from Alaska should
begin with ‘1M1…’)
See Appendix A for SQL query details. The ‘ERARELEASES’ filter query,
in contrast to recoveries, does minimal joining (STKCDS to Releases) and
reformats the release data in prep for CAS import. Step 3 should yield
two text files: ERARELEASES.TXT and ERARECOVERIES.TXT
Load filtered CWT data into CAS
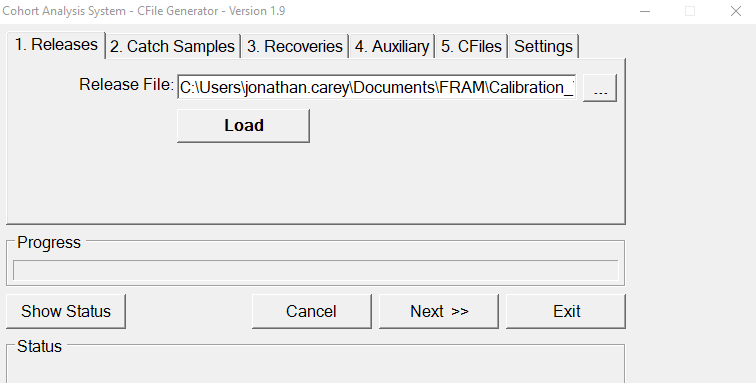
Using the CAS_1.9.exe program (CAS program or CAS.EXE hereafter), the
ERARELEASE.TXT and ERARECOVERIES.TXT files can now be imported into the
FRAM-CAS database.
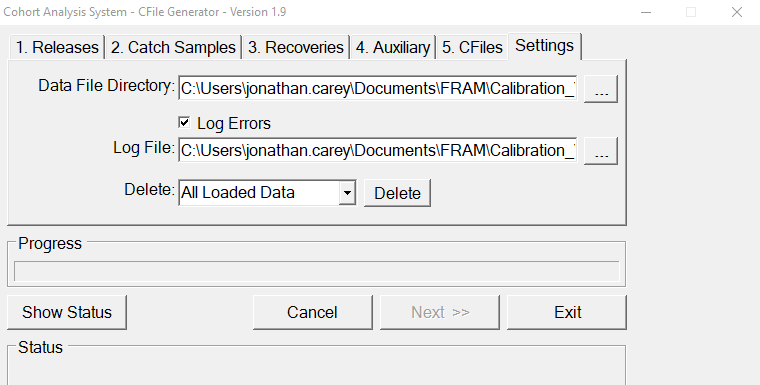
Depending on the application, you may want to first clear out the
entire FRAM-CAS database, using the CAS program (Figure 7.1). First,
however, you must connect your CAS program to the FRAM-CAS database with
which you’re working (you will be prompted to do so upon opening the
program). Once connected, you can clear things out as needed (Figure
7.1) and then you’re ready to import filter database output releases
(Figure 7.2), recoveries, and/or any auxiliary files (discussed further
below).
The procedure for each file type is the same, you first point the
program to the appropriate release, recoveries, or auxiliary text file
(.TXT or .CSV) and menu, then you click ‘Load’ and wait for the process
to complete. Once CAS has finished loading the data, you should examine
the running CAS error log (‘CASErrors.TXT’, this is written where the
program occurs) and the ’*.BAD’ (a text file) associated with each input
you’ve attempted to load. These will describe which (if any) records
were rejected and offer clues regarding why this occurred.
Troubleshooting rejected releases and recoveries
Typically a handful, and sometimes many, records will be rejected
during the FRAM-CAS database loading process. This can feel like the
most cumbersome step of the FRAM-CAS database loading process, but with
some patience and insight is relatively easy to work through. The good
news is that, generally speaking, once a solution to a parsing problem
or release rejection problem is resolved in the FRAM-CAS database, it
will address all future instances subject to the same circumstances
(and/or future reloads).
Common problems and solutions include (solution in italics):
- For releases, this can arise because the stock code isn’t included
in the ‘SpeciesStock’ database table (this shouldn’t happen, but if it
does, see CTC help file guidance) - upon adding the new stock’s
details, it should load correctly
- For recoveries, the recovery location may not be parsing in such a
way that can get a recovery from an RMIS location code all the way to a
CTC fine-scale fishery - in this case, you’ll have to manually add a
parsed location (with fine-scale fishery mapping) to the FRAM-CAS
database ‘FisheryLookup’ table, and reload the associated BAD
records - For example RMIS Location Code: “3F10510 080122 R” parses
to the fields in green, and you must supply the red info (Fishery = CTC
Fishery Stratum, CWDBFishery = RMIS Fishery Code, Species = 1 for
Chinook; gray fields can be left empty)
- In other cases, the recovery location might be parsing correctly,
but a fishery really isn’t part of the FRAM (or CTC universe). In rare
cases, for example, Chinook FRAM’s stocks have been recovered in net
fisheries in Cook Inlet and Prince William Sound. - These rarities
are not included and treated as though they’re ‘natural
mortality’.
- On rare occasions, RMIS contains records with a valid sample type,
but no ‘estimated number’ for a particular tag recovery. - In these
cases, the user must decide what to do, i.e., to enter a value or omit
altogether. - For example, if it’s likely a data error and in fact
each fish represents an individual (e.g., censused escapement at a
hatchery), then these records could be given an estimated number of 1.0
and reloaded. It is on the BP team, however, to make the call given
whatever information is available (regional expertise/contacts,
etc.).
- A portion of the auxiliary data you’re supplying isn’t part of the
tag set of interest. For example, a CTC member from Canada may supply
escapements for all of their stocks for all years in a single file,
whereas you’re only interested in 2005-2008 broods. - If this is the
basis for rejection, there’s nothing more that you need to do.
What are auxiliaries?
As noted above, so-called auxiliary CWT recovery files are also
loaded into the FRAM-CAS database during this stage of the overall
process, and are denoted as such in the ‘CWDBRecovery’ table
(‘Auxiliary’ = T/F field). These files, which are supplied by regional
experts who steward CWT recovery data for particular stocks or
fisheries, are meant to either augment or correct the data acquired via
RMIS for the tag groups in question. While the deficiencies/errors in
RMIS content and/or the basis for auxiliary file creation are beyond the
scope of this manual, these files are necessary to ensure that all
observations of tagged model stock cohorts are correctly captured in the
FRAM BP dataset. Because these datasets are routinely updated, it is
important to acquire the latest versions from the appropriate CTC
point(s) of contact prior to completing a full FRAM-CAS loading process.
Finally, similar input files may need to be created for any non-CTC
stocks necessitating similar supplementary or revisionary data (e.g.,
for unsampled freshwater sport fisheries in Puget Sound and Willapa
Bay). Because the CTC’s fine-scale fishery change routinely, if not
updating to the current version of the CAS database, it may be necessary
to modify auxiliaries to revert to the 2019 convention before using.
For further documentation on the CAS program and database, see the
design specs document prepared by Wostman and Associates, Inc. for ADFG
and the CTC, as well as the CAS help files located here: https://github.com/jon-carey/FRAMBuilder/tree/master/CTC%20CAS%20Documentation.
For more information on the FRAM-CAS database, and more specifically how
it has been modified to integrate FRAM functionality, see Appendix
B.
Run FRAMBuilder
When the FRAM-CAS database has been successfully loaded with the CWT
data needed for running the BP calibration, we have just a few
additional (albeit very important) steps to (1) complete the RMIS to
FRAM fishery mapping work, (2) process the selected tags/broods for the
selected stocks so they correspond to a single ‘super code’, and (3)
format and write calibration input files to the FRAM-CAS database. This
section covers the rationale and sequence of steps underlying this
process.
Mapping/adjustment rules
Before diving into the ‘how to’ details, here we summarize the main
rules/processing tasks that FRAMBuilder executes to map CWT recoveries
from CAS fishery purgatory to their final FRAM fishery/time step/age
stratum (within code, see the subroutine ‘BGworker_output_DoWork’ in
‘OutputOptions.vb’ for further detail). Note that the following special
mapping rules were revised in 2019 in accordance with updating from the
2013 CAS database and fishery structure to the 2019 CAS database and
fishery structure. Whenever specific criteria invoke special processing
rules, FRAMBuilder does the following:
- Split CAS Puget Sound Areas 10/11/13 Net (Fishery = 2315) and
Terminal Net (Fishery = 2316) into FRAM 10A, 10E, 10/11, 13A, and SPS
Net fisheries; this is done using the RMIS recovery location code. Also
assign 13C (Chambers) to freshwater net, consistent with TAMM treatment
of the fishery.
- Split CAS Puget Sound Areas 10/11/13 Sport (Fishery = 3311) and
Terminal Sport (Fishery = 3315) into FRAM Areas 10, 10A, 10E, 11, and 13
Sport fisheries; this is done using the RMIS recovery location code.
Recoveries are only assigned to 10A and 10E during July – September,
consistent with fishery regulations. Note that due to suspected errors
in data coding in RMIS, it is not possible to perfectly separate 10A/10E
from general Area 10 in some base period years.
- Assign recoveries mapped to CAS Puget Sound Area 8-2 Sport (Fishery
= 3308) during the summer to FRAM 8D (Tulalip Bay) sport, as general
Area 8 is closed to Chinook retention during the summer; this is done
using the recovery month.
- Assigned CAS Puget Sound Stilly/Sno Net (Fishery = 2313) and
Terminal Net (Fishery = 2314) recoveries that occur in 8D (Tulalip Bay)
to FRAM Tulalip Bay Net; this is done using the RMIS recovery location
code.
- Separate the KMZ component of CAS California Troll (Fishery = 1314)
and assign to FRAM KMZ Troll; this is done using the RMIS recovery
location code.
- Separate the KMZ component of CAS California Sport (Fishery = 3331)
and assign to FRAM KMZ Sport; this is done using the RMIS recovery
location code.
- Assign CAS Hood Canal Net (Fishery = 2318) and Terminal Net (Fishery
= 2319) recoveries that occur in 12H (Hoodsport) to FRAM freshwater net,
consistent with TAMM treatment of the fishery.
- Correct Washington Area 1 Troll recoveries that have historically
(incorrectly) been mapped (by CAS) to Oregon Area 3 Troll (Fishery =
1309).
- Separate the combined Bellingham Bay (Areas 7BCD) treaty/non-treaty
net fishery recoveries into separate treaty/non-treaty components.
Unfortunately, this ‘processing rule’ can’t be fully implemented in code
because a non-distinct (indiscernible treaty/non-treaty) fishery/gear
code combination precludes assignment with certainty for a non-trivial
percentage (>20%) of 7BCD recoveries. Thus, 7BCD net recoveries are
pre-processed externally (see supplemental file
‘BellinghamBayEvaluation_2019.xlsx’) to make individual tag ‘Tr/NT’
assignments based on fishery/gear codes in RMIS and/or annual
treaty/non-treaty catch proportions (see Appendix C). Once this
pre-processing step has been completed, FRAMBuilder will assign
recoveries to the appropriate FRAM fishery based on the values entered
in the ‘Tr_NT’ field of the CWDBRecovery table.
- Map recoveries assigned to CAS Washington Coast Net (Fishery = 2321)
that occur in Area 4B to FRAM JDF net.
- Map recoveries assigned to CAS Washington Area 2 Sport (Fishery =
3319) that occur in Willapa Bay and are of Willapa stock to freshwater
sport (because the model does not contain a Willapa Bay sport
fishery).
- Map all freshwater fishery recoveries, i.e., sport, net, B10 sport,
Col R Net, to the escapement fishery (fishery 74); this step facilitates
calibration in ETRS units, as desired under the new BP framework.
- Make and modify time step (TS) assignments as needed; TS assignments
are made initially based on the calendar month in which a recovery
occurred (month <4 & >=10 is TS1; 5&6 = TS2; 7-9 = TS3),
but in several instances things will have to be shifted slightly to
reflect the timing rules and biological assumptions built into the
calibration’s cohort reconstruction. For instance, since fall Chinook
are only allowed to mature in TS3, recoveries in freshwater
sport/net/escapement during TS1/4 are assigned to TS3.
- Determine the FRAM age equivalent for each fish. This is initially
done as ‘age = run year - brood year’, with subsequent adjustments to
reflect (a) fish having birthdays on Oct 1, (b) Willamette and
Cowlitz/Kalama/Lewis spring Chinook (yearling releases) having ages
treated as true age - 1 in FRAM, and (c) min (age 2) and max (age 5) age
constraints imposed by the model/cohort reconstruction. The origin of
this decrementing is undocumented (precedes FRAMBuilder 2.0) and only
applies to these two yearling release stocks; assumedly, this is because
they’re yearling releases with maturation in TS1/4.
- Identify sublegal recoveries for exclusion, as they should not be
used in the calculation of legal exploitation rates. This is done by
identifying recoveries that have reported lengths (from RMIS) that are
less than the lower bound of the size limit in the given
fishery/time-step. For southern US and Alaskan fisheries, size limit
regulations are in terms of total length. These are converted to fork
length for modeling purposes, using the total length to fork length
conversion from Conrad & Gutmann (1996). For fisheries where this
conversion was applied, the lower bound of the size limit was set to 2.8
cm and based on the sum of the 95% prediction interval for the
conversion (1.8 cm) and an estimated measurement error (1 cm). Size
limit regulations for Canadian fisheries are in terms of fork length,
thus the lower bound was set to 1 cm and represents only measurement
error.
Note, whenever any of these special processing rules is invoked
for a particular recovery, a record detailing related adjustments is
added to the FRAM-CAS database’s ‘FRAM_ProcessLog’ table
Merging & weighting
Beyond applying mapping/adjustment rules, a secondary function of
FRAMBuilder is to merge CWT data for a given stock within selected BP
broods and ultimately across broods to create a synthetic all-broods
‘super code’. The program is flexible and can accommodate a few
different merging approaches. Within brood years, merging can be done
either (1) on an unweighted basis (default) or (2) using user-specified
weights which are generated on a stock/code/BY basis and added to the
‘FRAM_Weights’ table. The first option treats all CWT release groups
within a stock/BY as though they’re equivalent and simply lumps them
together accordingly. Thus, if several hatcheries/groups make up a
single FRAM stock, they’re essentially self-weighting within BYs as a
function of the number of fish released and early marine survival. The
latter option allows users to specify weights that up/down weight
particular CWT codes/groups according to any rationale. For example, the
Skagit spring yearling model stock is actually a composite
fingerling/yearling stock for which user-supplied weights have been
developed to achieve a 50:50 representation of the two life history
variants in the pool of recovered CWTs.
Once codes are merged within BYs for a given stock, FRAMBuilder
merges the within-BY-merged CWT recovery data across BYs using one of
three approaches: (1) unweighted merging, (2) recoveries-weighted
merging [the default], or (3) user-specified weighting (Note that
user-specified between BY merging hasn’t been fully tested/vetted). The
first option is equivalent to the default within-year method in that BYs
are pooled as-is and thus self-weighting; this essentially means that
BYs with better survival and/or abundance will have greater influence in
the calibration dataset. The second and default option (‘recoveries
weighted’) is designed to rescale recoveries (i.e., R’FAT-b = Wb*RFAT-b)
within each brood year so that all BYs have equal influence on the
calibration dataset, i.e., for brood year b the weighting/scaling factor
(Wb) is computed as Wb = max(all Rb) / Rb, where Rb = RFAT-b and Rb and
RFAT-b are the estimated recoveries total for brood year b and the
fishery-age-time step-specific recoveries total within brood year b. As
above, the last option permits the user to specify (again, within the
‘FRAM_Weights’ database table) any weighting scheme that’s desired. This
latter option might apply, for example, when there’s an anomalous year
in the data series for a stock, exploitation or survival/abundance wise,
that contains some useful information but needs to be down-weighted to
avoid giving it undue influence on the final calibration dataset.
Note, the default weighting scheme emulates what’s historically
been assumed/done for Washington’s Puget Sound stocks within the PSC
Chinook Model calibration procedure
Output file creation and database population
Once data processing is complete, FRAMBuilder writes several results
to the FRAM-CAS database, with specific RunID attribution (a unique
date-time based stamp). The main outputs of interest are:
- The ‘FRAM-OUT_CWTAll’ table; this contains the results for the
processing run in a format (merged, etc.) that can be fed directly into
the main calibration program. Note that some post-processing is
currently needed to create the full 39/78 stock structure dataset (see
Apendix C), which occurs in an excel file called
‘Calibration_CWT_Inputs; MM.DD.YY.xlsx’ and requires output from the
‘FRAM_star_CWT’ table.
- The ‘FRAM_star_CWT’ table; this contains mapped/summarized results
for various stages in the processing sequence, i.e., mapped
stock-fishery-age-TS totals by code (indicated by raw code ID), by BY
(Xyy.STK where yy and STK are the BY and 3-letter stock ID), and ‘super
code’ (ABmm.STK, AB for ‘all broods’ and mm is the merging method ID and
STK is as above)
- The ‘FRAM_ProcessLog’ table contains info about what special rules
(listed above) were invoked in a given processing run for a particular
recovery ID;
- The ‘CWDBRecovery’ table, the main recovery table feeding the entire
process, has a field (‘finalFmap’) that gets populated with the
numerical ID for the fishery to which a given recovery was ultimately
mapped; this result is quite useful for both error checking and post-run
summarization (e.g., for other purposes).
- If summary files for estimating growth functions are necessary (and
this processing option is selected), FRAMBuilder will also write results
to ‘FRAM_GrowthData’;
- If ‘old school’ outputs are needed (e.g., *.CWT files, text based
process logs, etc.), the checkbox allowing for this feature will need to
be reactivated so that these text-based calibration inputs are
created.
Running the full processing sequence
Now, with a clear understanding of what’s needed to get data from
RMIS to FRAM-CAS in a state that’s ready for processing, it’s time to
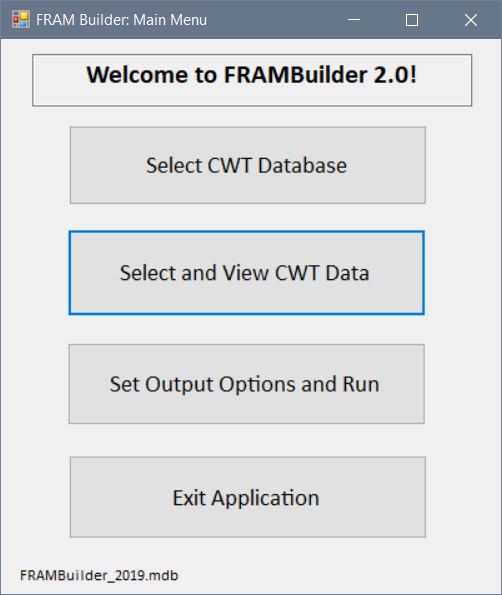
actually run the program. First, open the FRAMBuilder program by running
it in debugging mode once you’ve opened the VB.NET solution, and then
connect it to your FRAM-CAS database by clicking ‘Select CWT Database’
when you reach the Welcome Screen.
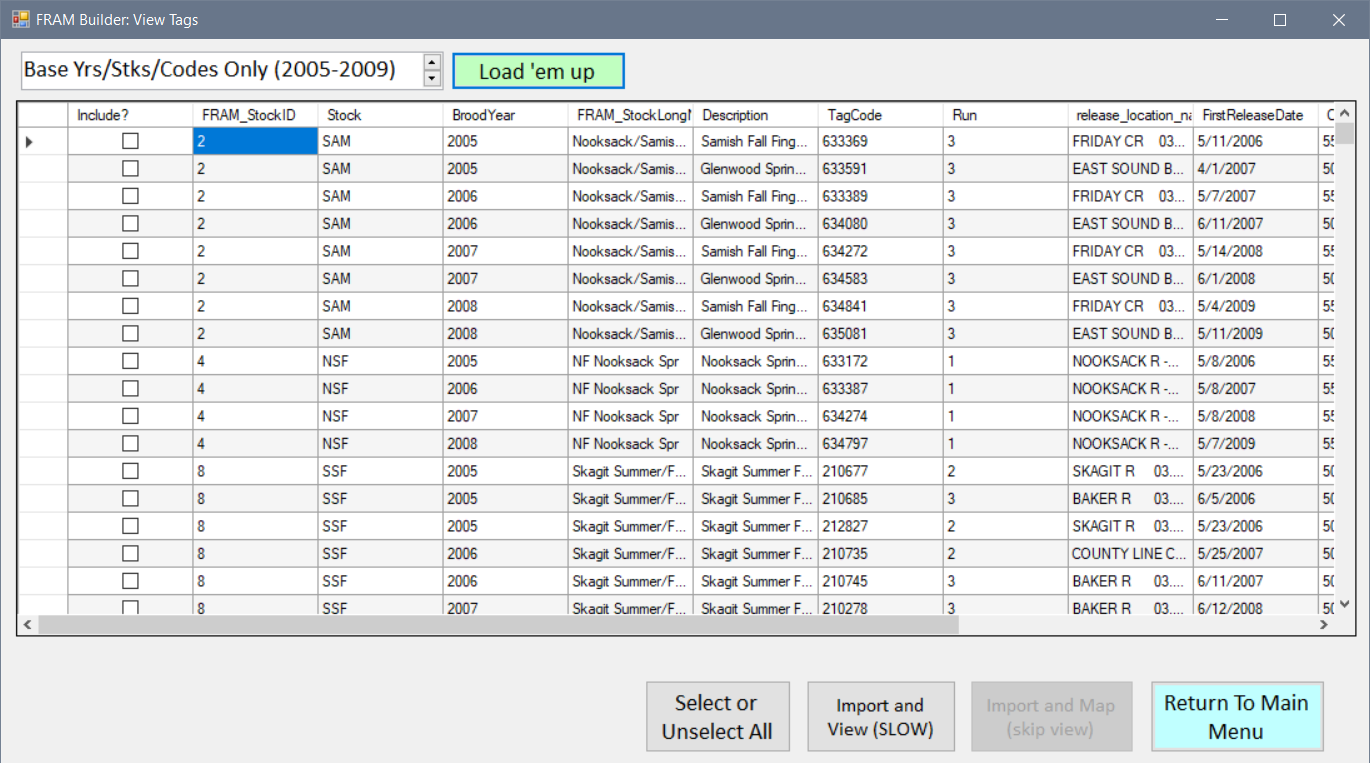
Second, once you’ve connected, click the second button (‘Select and
View CWT Data’) on the welcome screen. This will take you to a form in
which you’ll actually choose the specific CWT codes that you’re
interested in mapping/processing for the calibration process. Upon
reaching this screen, the subset (if appropriate) of tags contained in
the database desired for viewing/editing must be selected using the
toggle list and ‘Load ‘em up’ button. Next, selecting particular codes
is achieved by clicking check boxes (leftmost column, ‘Include?’) or by
clicking select/unselect all. Thereafter, the FRAM-CAS database will be
queried for the relevant content, which you can view prior to
processing
Upon selecting desired codes/stocks via this screen, you’ll get a
chance to view raw recovery data (click ‘Import and view’ upon
selecting) prior to initiating the processing sequence Note, this
query-to-view step is rather slow (10s of seconds for a few 100K
records), because things get bogged down query-wise on the MS Access
side — be patient!
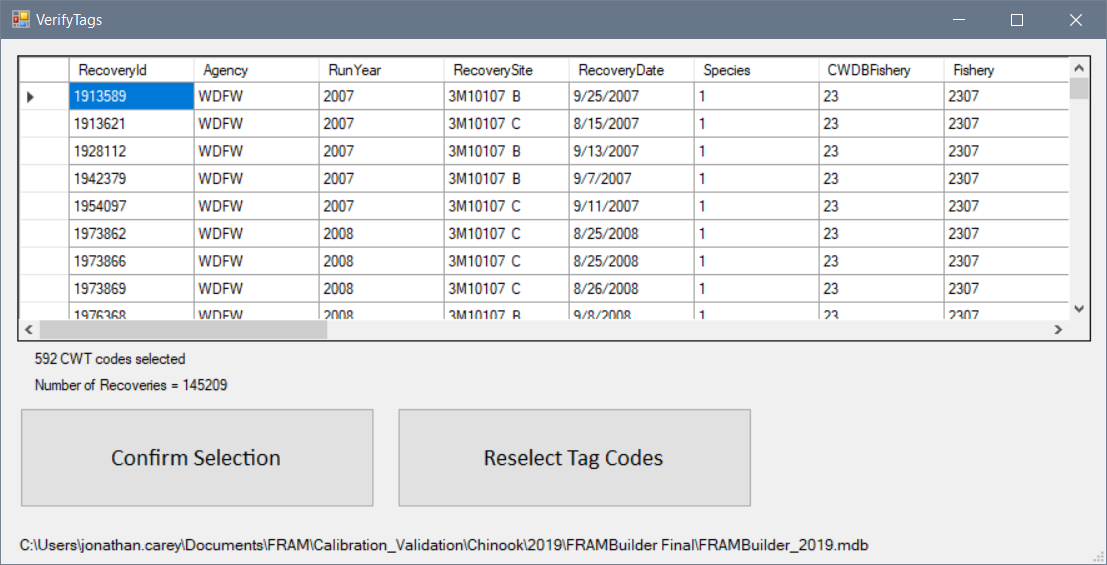
The next window will show you the raw recoveries, which are now
queued for processing. This is a quick stop between selecting codes and
moving into processing the queued dataset. You can basically click
‘Confirm Selection’ as soon as you arrive here, or peruse data to your
heart’s content. After returning to the main menu, you’ll navigate to
the processing menu by clicking ‘Set Output Options and Run’.
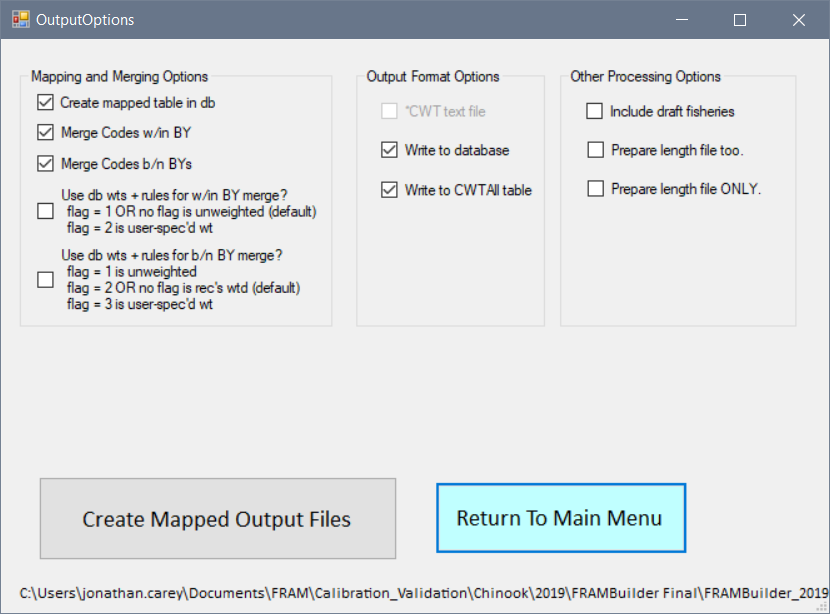
Now you’re ready to set the specifications for the particular mapping
and data processing/prep run, which you’ll do in the ‘Output Options’
form. For most runs, you’ll want to process things according to the
defaults, which are already checked when the form loads. The output
options include:
- Merging and Mapping Options
- ‘Create mapped table in DB’ [Default = True]. [note that this is in
contrast to the old ’*.CWT’ calibration file format, which can still be
created using a disabled feature]
- ‘Merge Codes w/in BY’ [Default = True].
- ‘Merge Codes b/n BY’ [Default = True].
- ‘Use db wts + rules for w/in BY merge?’ [Default = False].
- ‘Use db wts + rules for b/n BY merge?’ [Default = False].
- Output Format Options
- ‘Write to database’ [Default = True]. [Note, this should generally
be left checked, perhaps even locked, as without it and the *.CWT out
file format being deactivated, the mapping sequence will produce little
of use]
- ‘Write to CWTAll table’ [Default = True]. [Note, this should
generally be left checked, perhaps even locked, as without it and the
*.CWT out file format being deactivated, the mapping sequence will
produce little of use]
- *.CWT text file. [this is the old calibration program’s preferred
format]
- Other Processing Options
- ‘Include draft fisheries’ [Default = False]. [Note, this was a field
we added to inventory and explore possibilities of breaking apart a
handful of fisheries, e.g., 3/4/4B troll into separate 3 and 4/4B
fisheries; if it’s invoked, it includes both the original fishery
mapping, plus the experimental mapping]
- ‘Prepare length file too’ [Default = False].
- ‘Prepare length file ONLY’ [Default = False]. [use this option if
you just want to use FRAMBuilder to create summary files for estimating
growth function parameters]
Once you’ve selected the specifications desired for the run, click
‘Create Mapped Output Files’ on the Output Options form to initiate the
mapping/merging/output creation procedures described above. If you have
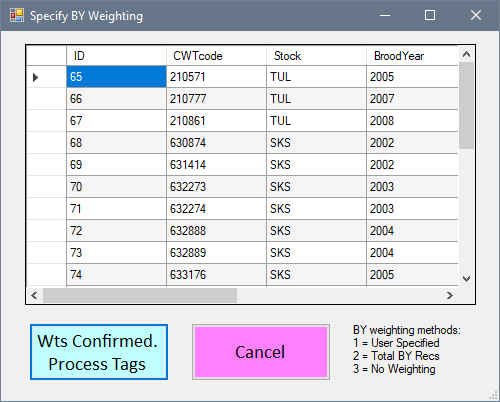
checked either the ‘Use db wts + rules for w/in BY merge?’ or ‘Use db
wts + rules for b/n BY merge?’ boxes, a dialog box will appear
displaying the user specified flags and weights provided in the
‘FRAM_Weights’ table of the database. To confirm these values, click the
‘Wts Confirmed. Process Tags’ button.
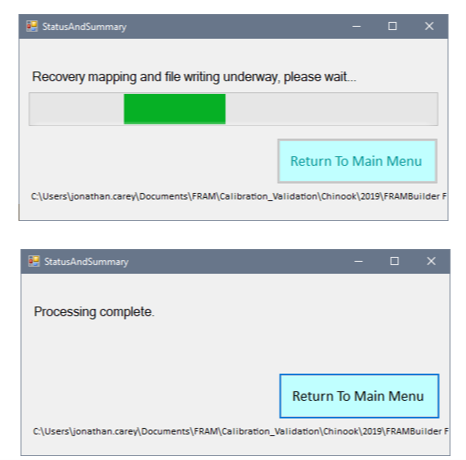
Following this (or if you did not select either of the two above
boxes) the view will shift to the ‘StatusAndSummary’ form screen which
will display a scrolling green bar until the run is complete, at which
point it will shift to a status of ‘Processing complete’. Note that the
full processing sequence, although conceptually simple, may take several
minutes when it’s run for the entire base period dataset at once; again,
this is due to the slow nature of MS Access queries (of which there are
multiple in this sequence) in VB.NET applications.
Export data
Aside from generating old-format (.CWT) text files and populating the
FRAM-CAS database, FRAMBuilder does not produce any files extending
beyond these stages. Thus, the end user must work directly within the
FRAM-CAS database in order to acquire/use processing results in
subsequent calibration procedures. The ‘FRAM-Out_CWTAll’ and
‘FRAM_star_CWT’ tables contain the primary data of interest to the Main
Calibration Program. To extract results for further use, first filter
data on the FRAMBuilder run of interest (filter on ‘ID’ field) and
simply copy-paste it into an Excel spreadsheet (or export in any format
as desired). The current template for this is called
‘Calibration_CWT_Inputs; MM.DD.YY.xlsx’ and includes a few notes about
the post-processing steps needed (see Appendix C for details) to
generate a final dataset for input into the Main Calibration Program’s
database. Otherwise, further review of processing results can be
achieved by looking at the raw recovery level (‘CWDBRecovery’ table) or
by viewing mapped code-, merged-within-BY-, or
merged-across-broods-specific results in the ‘FRAM_star_CWT’, which
correspond to the pieces that have been rolled up into the final
composite ‘FRAM-Out-CWTAll’ table. Beyond these components, the
length-at-age prep (‘FRAM_GrowthData’) file can be exported for further
processing/review in Excel, R, etc.
Limitations to FRAMBuilder and opportunities for enhancement
Like any program that’s been designed to automate and streamline an
unwieldy and complex data processing task that necessarily requires some
expert oversight and occasional ad hoc revisions, FRAMBuilder is far
from a distributable, production-grade program. Rather, it’s a tool for
streamlining one of the more cumbersome tasks that the BP calibration
team has to complete in order to create a new base period dataset.
Accordingly, there are (and will always be) opportunities for enhancing
the program, both in basic ways that pertain to its current
structure/algorithms and through the addition of new/different
processing features. A few low-hanging fruits that may be worth
considering are:
- Offer a means to do some of the post-processing required to
replicate ‘FRAM-OUT_CWTAll’ content for some stocks as required for
surrogate or other purposes (e.g., NF Nooksack for both SF and NF; also
in surrogate cases; see Appendix C for more on these).
- Automate, to the extent possible, the processing required to split
7BCD Net data into treaty and non-treaty components; the current
external procedure, although straightforward, opens the door to errors
and is easy to forget if new databases are being updated/created. This
workflow could be modeled after the companion spreadsheet described in
Appendix C.
- Automate the development of ‘user-supplied’ weights for within BY
merging; as described in Appendix C in the case of Skagit spring
fingerlings and yearlings, the process is more complicated than one
might think (i.e., you’re working backwards to determine needed
weights/scalars to achieve a target 50:50 representation in CWT
recoveries).
Beyond these minor enhancements, IF calibration becomes a
routine/updateable process, some bigger-picture enhancements worthy of
consideration are:
-(higher priority) Update the FRAM to CAS linkage so
that FRAMBuilder is not stuck in static ‘old CTC’ [currently 2019]
fishery mappings; this could be achieved in a number of ways, ranging
from relatively simple (e.g., update crosswalk table) to more
complicated (e.g., integrating CAS.exe’s parsing/mapping code directly
into FRAMBuilder to ‘cut out the middle man’); the former probably makes
the most sense so that annually developed auxiliaries are readily usable
in the FRAMBuilder workflow. In 2019, work was completed to update the
FRAM-CAS database and FRAMBuilder 2.0 application code for compatibility
with the 2019 version of the CTC’s CAS database and fishery strata (See
Appendix D for details). Versions of FRAM-CAS database, application
code, and output data created prior to 2019 were based on the 2013
version of the CTC’s CAS database and fishery strata (see also Appendix
D notes on this subject). - (low priority, given how infrequently
calibrations occur) Marry FRAMBuilder directly to the Main Calibration
Program and the FRAM-CAS content to the Calibration Database’s
architecture (or the reverse). This would streamline things on the
implementation front, which may not be a huge priority since
calibrations occur infrequently. - (low priority, given how infrequently
calibrations occur) Identify ways (MS Access query structure, program
architecture, or otherwise) to speed the program up. As noted
previously, this isn’t worth losing much sleep since it’s not THAT slow
in the grand scheme and calibrations occur intermittently at best. But
something to ponder anyway.
Appendix A: CTC Filter Database Recoveries Query Details/notes
SELECT RECOVERIES.recovery_id, RECOVERIES.recovery_date, RECOVERIES.period_type, RECOVERIES.period, RECOVERIES.species, RECOVERIES.sex, RECOVERIES.length, RECOVERIES.length_code, RECOVERIES.tag_code, RECOVERIES.tag_status, RECOVERIES.estimation_level, RECOVERIES.recovery_location_code, RECOVERIES.fishery, RECOVERIES.estimated_number, RECOVERIES.sample_type, RECOVERIES.run_year, RECOVERIES.recorded_mark, RECOVERIES.catch_sample_id, RECOVERIES.detection_method, RECOVERIES.reporting_agency FROM RECOVERIES INNER JOIN STKCDS ON RECOVERIES.tag_code = STKCDS.CODE
#across all subsets, the ‘not like 1M1DF*’ and ‘not like 1M2*’
statements filter out AK recoveries outside of Southeast # #across all
subsets, sample_type <> 5 excludes voluntary recoveries with no
awareness #
#no high seas recoveries included for WA/ColR/OR/CA {164,878
recoveries}#
WHERE (((RECOVERIES.recovery_location_code) Not Like '1M1DF\*' And (RECOVERIES.recovery_location_code) Not Like '1M2\*') AND ((RECOVERIES.fishery)<"60") AND ((RECOVERIES.sample_type)<>"5") AND ((STKCDS.REGION) In ("WASH","COLUMBIA","OREGON",”CALIFORNIA”)))
#no Canadian escapements (they’re entered as auxiliary data) {3,164
recoveries}#
OR (((RECOVERIES.recovery_location_code) Not Like '1M1DF\*' And (RECOVERIES.recovery_location_code) Not Like '1M2\*') AND ((RECOVERIES.fishery)<"50") AND ((RECOVERIES.sample_type)<>"5") AND ((RECOVERIES.reporting_agency)="CDFO") AND ((STKCDS.REGION)="CANADA"))
# [not relevant as FRAM contains no stocks originating from AK] For
AK, include standard fisheries and marine trap (net) #
OR (((RECOVERIES.recovery_location_code) Not Like '1M1DF\*' And (RECOVERIES.recovery_location_code) Not Like '1M2\*') AND ((RECOVERIES.fishery)<"49" Or (RECOVERIES.fishery)="94") AND ((RECOVERIES.sample_type)<>"5") AND ((RECOVERIES.reporting_agency) In ("ADFG","NMFS")) AND ((STKCDS.REGION)="ALASKA"))
# recoveries of Canadian stocks outside of Canada {1,847 recoveries}
#
OR (((RECOVERIES.recovery_location_code) Not Like '1M1DF\*' And (RECOVERIES.recovery_location_code) Not Like '1M2\*') AND ((RECOVERIES.fishery)<"60") AND ((RECOVERIES.sample_type)<>"5") AND ((RECOVERIES.reporting_agency)<>"CDFO") AND ((STKCDS.REGION)="CANADA"))
# [not relevant as FRAM contains no stocks originating from AK] #
OR (((RECOVERIES.recovery_location_code) Not Like '1M1DF\*' And (RECOVERIES.recovery_location_code) Not Like '1M2\*') AND ((RECOVERIES.fishery)<"70" Or (RECOVERIES.fishery)="94") AND ((RECOVERIES.sample_type)<>"5") AND ((RECOVERIES.reporting_agency) Not In ("ADFG","NMFS")) AND ((STKCDS.REGION)="ALASKA"))
#recoveries of Canadian stocks in SUS test fisheres {0
recoveries}#
OR (((RECOVERIES.recovery_location_code) Not Like '1M1DF\*' And (RECOVERIES.recovery_location_code) Not Like '1M2\*') AND ((RECOVERIES.fishery)>="60" And (RECOVERIES.fishery)<"70") AND ((RECOVERIES.sample_type)<>"5") AND ((RECOVERIES.reporting_agency) Not In ("ADFG","NMFS","CDFO")) AND ((STKCDS.REGION)="CANADA"))
#recoveries of SUS stocks in SUS test fisheres {68 recoveries}#
OR (((RECOVERIES.recovery_location_code) Not Like '1M1DF\*' And (RECOVERIES.recovery_location_code) Not Like '1M2\*') AND ((RECOVERIES.fishery)>="60" And (RECOVERIES.fishery)<"70") AND ((RECOVERIES.sample_type)<>"5") AND ((RECOVERIES.reporting_agency) Not In ("ADFG","NMFS","CDFO")) AND ((STKCDS.REGION) In ("WASH","COLUMBIA","OREGON",“CALIFORNIA”)));
Appendix B: Overview of the FRAM-modified CAS database
The FRAM-CAS database (and filter database) is an adaptation of the
PSC Chinook Technical Committee’s 2019 final preseason CAS database
(available through the CTC sharepoint site [Analytical Work Group ->
Exploitation Rate Analysis -> 2019], however, this requires a
username and password – feel free to contact your friendly neighborhood
CTC member for help). Thus, it’s rooted in the CTC’s fishery mappings in
effect at that time (e.g., maybe escapement code = 4008 is a memory
jogger for those who follow details of CTC fishery mappings). Beyond
what that base CAS contained, several tables were added to fill
FRAMBuilder’s mapping needs. All of these have a naming convention of
‘FRAM_…’ so that they can be easily distinguished from the base CAS
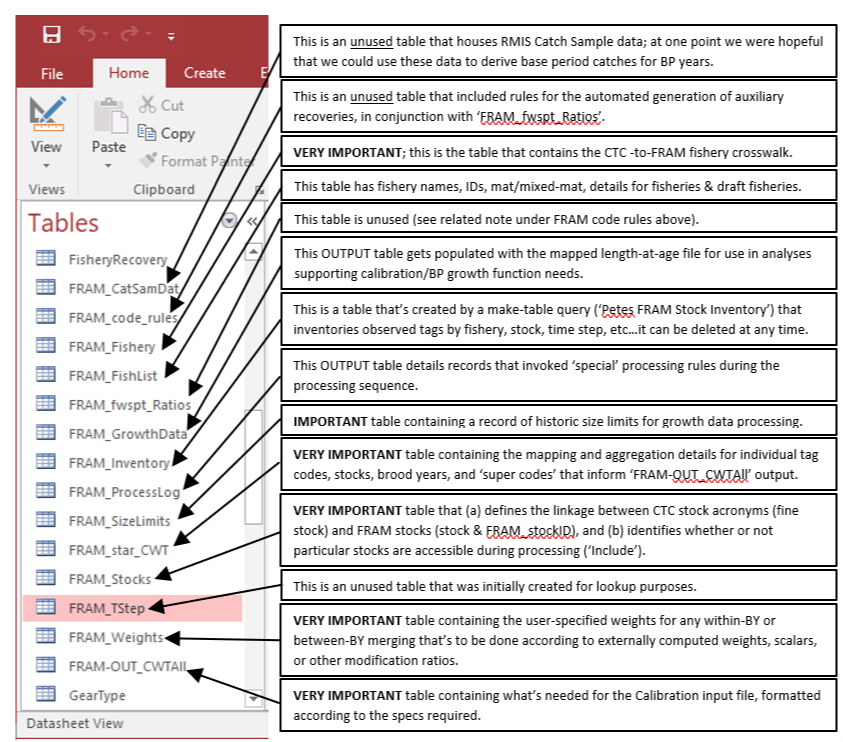
content (Figure B1). While the details associated with these additions
and modifications are summarized here, the user is referred to the CTC’s
CAS documentation for detail on the other database content/schema, etc.,
which is available at: https://github.com/jon-carey/FRAMBuilder/tree/master/CTC%20CAS%20Documentation
The main database tables that help FRAMBuilder in either the
CAS-to-FRAM fishery or stock crosswalk/mapping process are:
FRAM_Fishery – this table provides the FRAM equivalent
fishery or fisheries (there are some one-to-many cases to the CTC
fishery strata) that records are initially mapped to when loaded using
CAS.exe; this table is crucially important to FRAMBuilder’s ability to
leverage CTC resources to get CWTs ultimately to FRAM fisheries. [Note,
if there’s ever a desire to update FRAM-CAS to a new set of CTC fishery
mappings, a similar crosswalk will need to be built off of the ‘Fishery’
table in a newer version of CAS and code changes (within special rules)
will also be required].FRAM_Stocks – this table is the primary means to
collapse CTC (or other) stocks from finer stocks (e.g., specific
hatcheries) into FRAM stock aggregates, as appropriate. The ‘FineStock’
field here corresponds to the ‘Stock’ field in both of the CAS’s
‘WireTagCode’ and ‘SpeciesStock’ tables; ‘Stock’ in ‘FRAM_Stocks’
corresponds to higher-level aggregates to which ‘FineStocks’ will be
collapsed (e.g., GRN, Green River is part of ‘SPS’, etc.); note also
that this table provides (a) the numerical mapping of stock codes to
numerical FRAM stock ID values and (b) a means to filter what’s accessed
(‘Include’ field) during data viewing/processing via FRAMBuilder.FRAM_Weights – this table contains the user-specified
weights and flags (wnBYmeth 1 = unweighted, 2 = user specified; bnBYmeth
1 = unweighted, 2 = recoveries weighted, 3 = user specified) for any CWT
codes that will be modified according to user-specified weights during
either the within- or between-brood merging process. Whenever
user-specified rules are desired, values must be provided for all codes
or the procedure will crash; [Note, this table only needs information
for an individual stock that requires special weighting; defaults are
applied if left alone for all other stocks/codes]
Beyond these key mapping tables, FRAMBuilder’s key output tables are
described in the main document and further identified visually in Figure
B1. Note also, however, that the FRAM-CAS database tables ‘CWDBRecovery’
and ‘WireTagCode’, both base tables from the original CTC CAS database,
include new fields that permit either processing or summarization.
‘CWDBRecovery’ includes the fields ‘finalFmap’ and ‘Tr_NT’ which were
described previously; ‘WireTagCode’ includes the Boolean field
‘FRAM_OOB’ which is used to identify which codes/releases should be
treated as Out-of-Base codes and ‘BP_Notes’ which is available for
adding notes indicating special attributes about a particular code; the
‘BP_Stock’ field is available for additional notes but to date has not
been used. Lastly, there are a handful of ‘FRAM_…’ tables included that
were either initially created for lookup purposes or to fulfill add-on
needs. These include: (1) FRAM_CatSamDat, (2) FRAM_code_rules, (3)
FRAM_fwspt_ratios, and (4) FRAM_TStep. And there’s a single table
created by a make table query (Petes FRAM Stock Inventory, plus
variations for different years) for inventory purposes called
‘FRAM_Inventory’; this is deleted and recreated every time the query is
run, so delete as you like.
Appendix C: “Don’t Forget” external data pre-processing steps
In no particular order, this is a list of a few processing/data
modification steps that need to be taken before data can be fully ground
through the FRAMBuilder mill.
- There are a number of ‘post-FRAMBuilder’ processing steps that need
to occur after the successful completion of a FRAMBuilder run but before
the CWTAll and CWT_OOB outputs get loaded into the Calibration support
database. These steps are detailed in the accompanying spreadsheet
titled ‘Calibration_CWT_Inputs; MM.DD.YY.xlsx’, available at https://github.com/jon-carey/FRAMBuilder. These steps
include, but are not necessarily limited to: a. Duplicated stock data
(NFNK Sp for SFNK Sp, SkagFF for Skag FYr, SPS FYr for UWAcc) b. JDF
Surrogate CWT data (modified from STIL) c. Imputed Age 5 escapement
d. Tulalip Net recoveries from TS2 pushed into TS3 e. Modified 10E Net
recoveries (to achieve 97% MPS contribution) f. Modified CWT recoveries
to address unrealistic Age 5 BPERs g. Imputed WA North Coast recoveries
in Grays Harbor Net h. White River OOB escapement tags apportioned into
TS2 and TS3 i. Modification to White R recovery in 8-1 sport with
unrealistic expansion
- Any auxiliary records (particularly those generated by the CTC)
obtained in 2020 or beyond will potentially require reverting fishery
mappings to the 2019 CAS fishery strata, for compatibility with the
‘FRAM_Fishery’ lookup tabe.
- To create an LCN stock base CWT file, a composite Oregon and
Washington LRH stock CWT input files (releases, recoveries) needs to be
duplicated and given dummy codes to be used to parameterize the LCN
stock; this modification applies to both data downloaded from RMIS AND
Auxiliary files involving LRH fish.
- User-specified weights need to be generated to create the 50:50
merged Skagit spring fingerling/yearling stock (stock ID #12); an
example of how this is done is contained in the supplied companion
spreadsheet called ‘SkagitSp_FingYrlWeighting_Rnd7_5.14.2019.xlsx’,
which is available at https://github.com/jon-carey/FRAMBuilder. Note also that
the ‘Stock’ and ‘FRAM_StockID’ fields in ‘FRAM_Stocks’ need to be
concurrent for the two stocks (e.g., assign ‘Stock’ = SKS and
‘FRAM_StockID’ = 12 for both).
- Perhaps the most clunky (annoying?) external data preparation step,
you will need to populate a field within ‘CWDBRecovery’ for all Areas
7BCD Net fishery recoveries so that Treaty/Non-treaty recoveries can be
distinguished during processing [note, aside from Treaty Troll and 7BCD,
no attempt is made to parse Treaty/NonTreaty within FRAMBuilder ].
Unfortunately, this cannot be automated within FRAMBuilder because CAS
does not get loaded with sufficient information to make the distinction,
where such a distinction is possible, and a non-trivial percentage of
7BCD recoveries cannot be assigned even if CAS had all of the RMIS data
on earth (~30% of recoveries receive a non-descript net fishery recovery
code, one that’s not attributable to a fisher type); thus, within the
external preparation spreadsheet, the original 7BCD data loaded into
FRAM-CAS are removed, parsed out (by additional details, either
supplementary RMIS data or catch fractions), and placed back into CWDB
with a newly populated ‘Tr_NT’ field. Note that recoveries that cannot
be distinguished are split fractionally based on run year catch
fractions (i.e., treaty % of landed, non-treaty % of landed) which
necessarily means that those records have to be duplicated and have
their associated recovery total split accordingly; this is all completed
and illustrated in the companion spreadsheet file
‘BellinghamBayEvaluation_2019.xlsx’ which can be downloaded at https://github.com/jon-carey/FRAMBuilder.
Appendix D. Updates for compatibility with 2019 CAS fishery
strata
In 2019 work was completed to update both the FRAM-CAS database and
the FRAMBuilder 2.0 application code for compatibility with the 2019
version of the CTC’s CAS database and fishery structure. The impetus for
this update stemmed from the desire to re-query recovery data from RMIS
in 2019, as there were numerous known (and likely numerous unknown)
updates that had occurred since the data were previously queried in
~2014 (i.e., updates to Columbia River Summer Chinook escapement
expansions, GMR updates to Stillaguamish escapement expansions, etc.).
Additionally, it had been a number of years since the CTC’s auxiliary
data had been updated. With that, the decision was made to start from
scratch, building off of the CTC’s final preseason 2019 CAS database.
The steps were as follows: [Note: these steps are also detailed in the
file ‘FRAMBuilder DB Updates_2019.xlsx,’ which, in addition to the other
files referenced below, can be downloaded at https://github.com/jon-carey/FRAMBuilder]
- Obtain the complete list of base period tag codes from the most
recently used version of FRAM-CAS database (in this case, ‘2016
FRAMBuilder_Rnd6.mdb’).
- Query RMIS for the necessary release and recovery data, per the
instructions contained in Section 5 (Step 2) of the main body of this
document.
- Obtain a blank filter database, load in the release and recovery
data, and update the ‘STKCDS’ tables as necessary. Run and export the
‘ERARELEASES’ and ‘ERARECOVERIES’ queries, per the instructions in
Section 6 (Step 3) of the main body of this document.
- Note that there are 64 recovery records in the resulting
‘ERARECOVERIES’ table that have sample_type = 2, recovery_location_code
that begins with ‘6F…’ and no estimated_number. The estimated_number for
these records was updated to 1.
- Obtain a copy of the 2019 final preseason CAS database, rename as
desired (2019 FRAM-CAS herafter) and delete all records from the
‘CWDBRecovery’ and ‘WireTagCode’ tables.
- Copy the following tables from the previous FRAM-CAS database (see
step 1) into the 2019 FRAM-CAS database: • FRAM_CatSamDat •
FRAM_GrowthData • FRAM_code_rules • FRAM_Inventory • FRAM_Fishery •
FRAM_ProcessLog • FRAM_FishList • FRAM_SizeLimits • FRAM_fwspt_Ratios •
FRAM_star_CWT • FRAM_Stocks • FRAM-OUT_CWTAll • FRAM_Tstep • RelLoc •
FRAM_Weights
- Add the following record to the ‘Fishery’ table in the 2019 FRAM-CAS
database (this record was identified as necessary during the iterative
process of loading records into the database using CAS_1.9.exe and
examining the records that did not map correctly in the ‘.bad’
file):

- Add the following records to the ‘FisheryLookup’ table in the 2019
FRAM-CAS database (these records were identified as necessary during the
iterative process of loading records into the database using CAS_1.9.exe
and examining the records that did not map correctly in the ‘.bad’ file;
note that there are additional fields to the left of ‘SubLocation’ in
the table, however, they are blank for each of these records, so they
were omitted here):

- Add the following record to the ‘RelLoc’ table in the 2019 FRAM-CAS
database (this record was identified as necessary during the iterative
process of loading records into the database using CAS_1.9.exe and
examining the records that did not map correctly in the ‘.bad’
file):

- Ensure that all records in the ‘SpeciesStock’ table of the previous
FRAM-CAS database are present in the 2019 FRAM-CAS database. There will
be some FRAM-specific stocks that will need to be added to the 2019
database. There may also be some records in the 2019 database that are
not present in the previous FRAM-CAS database – these are stocks used by
the CTC but not FRAM and can either remain in the table or be
deleted.
- Delete records in the ‘StockBrood’ table of the 2019 FRAM-CAS
database and replace with the records contained in the ‘StockBrood’
table of the previous FRAM-CAS database.
- Use the CAS program (in this case CAS_1.9.exe) to load the releases
and recoveries files that were produced by the filter database queries
(‘ERARELEASES_5.2.19.txt’ & ‘ERARECOVERIES_5.2.19.csv’; see steps 3
& 4 above).
- Load in CAS auxiliary records produce by the CTC. Rather than
loading using the CAS program, this was accomplished by querying the
2019 CAS database for all records in the ‘CWDBRecovery’ table with the
‘Auxiliary’ field equal to TRUE, then filtering the records to only
those with tag codes used in the FRAM base period. These records were
then pasted into the ‘CWDBRecovery’ table of the 2019 FRAM-CAS database
(see file ‘2019_CAS_Auxiliaries_7.31.19.xlsx’ for details).
- Use the CAS program (in this case CAS_1.9.exe) to load additional,
non-CTC auxiliary recoveries including those that account for lack of
sampling in WA freshwater sport fisheries (‘WA_FWspt_CAS_load.csv’) and
inter-dam loss (‘IDL_Aux_CASload_10.3.19.csv’).
- Beginning in 2019, WSH freshwater sport and escapement auxiliaries
were handled via a CAS query rather than by generating and loading
separate auxiliary records. Ensure that these expansions are properly
accounted for (see WSH_Aux tab in ‘FRAMBuilder DB
Updates_2019.xlsx’).
- Update fields in the CWDBRecovery table to reflect those in the
previous FRAM-CAS database: - There are three fields that will need to
be deleted (the three rightmost columns: ERAAge, SSMA_TimeStamp,
AuxLoadID) - Two fields will need to be added (finalFmap, Tr_NT)
- Update fields in the WireTagCode table to reflect those in the
previous FRAM-CAS database: - Three fields will need to be added
(FRAM_OOB, BP_Stk, BP_Notes – see previous FRAM-CAS database for tag
code specific values
- There are 14 White River tag recoveries that need to be removed from
the CWDBRecovery table – see the ‘Removed White Tags’ table in the
previous FRAM-CAS database for a list of RecoveryIDs.
- Create a ‘dummy stock’ for LCN that is a combination of the WA and
OR tule stocks (LRH, LCW, KAL, CWF, and WAS). See the ‘LCN_WireTagCode’
and ‘LCN_CWDBRecovery’ tabs in ‘FRAMBuilder DB Updates_2019.xlsx’.
- Assign Bellingham Bay net recoveries to treaty or non-treaty (see
item 5 in Appendix C and ‘BellinghamBayEvaluation_2019.xlsx’).
Requirements
Main Calibration Program
For the development of the new base period, the original calibration
programs were rewritten using “Visual Studio.net”. The original programs
were developed in QBasic and fragmented into many separate programs,
requiring substantial user effort to create and edit program input
files. Various processes were undocumented and disjointed. In many cases
the output from one program was used to create the input file for the
next program in the estimation process. Any data or selection changes
usually resulted in re-running all components of the system. The new
program was written in Visual Basic and consolidated the entire
calibration into one application. Input and output is now stored in the
same Access database. Data editing between runs is kept to a minimum.
Once the required data is updated in the database, a new base period can
be created in minutes. The new program has two main functions:
Produce all the output data needed to populate the FRAM model
with a new base period
The program can be run with 4 different
options
Create a transfer database for easy import of base period data
into the main FRAM database The user has several options to create
output
Requirments
The code for the program is posted in a GitHub
repository.
To
produce a new base period two files are required:
Executable: MainCalibration.exe
Please see the
GitHub repositiory to download the executable.
Access Calibration Database: CalibrationSupport_xxx.mdb.
Please see chapter
Database
Tables for a description of the tables. Please contact a member of
the FRAM team at WDFW or NWIFC for assistance with obtaining this
file.
To transfer calibration output into FRAM an additional transfer
database is required.
- Access Transfer Database: NewCalibrationBasePeriodTransfer.mdb
Please contact a member of the FRAM team at WDFW or NWIFC for assistance
with obtaining this file.
Prerequisites
Update all input database tables of the calibration database. These
are listed in Appendix table
Table Description .
Make sure that tables CWT_AllOOB and CWTAll
contain the latest FRAMBuilder output.
Considerations
For an OOB run the FishScaler table is updated in an
iterative process whereupon calibration output is imported into FRAM,
FRAM is run (see chapter
Instructions for Producing a New Base Period ) and updated fish
scalers from these runs are pasted into the calibration database.
In order to update the
MSP
conduct a “Total Run”. There are three tables in the calibration
database that exisit in a “marked version” and a “total version”. These
tables are BasePeriodCatch,
BasePeriodEscapements, and NonRetention. When
running a “TotalRun”, the tables with the total (marked + unmarked)
values, need to have these names, when running a “Marked Run” the marked
tables need to have these names. This will sometimes require renaming
BasePeriodCatch_Tot to BasePeriodCatch,
BasePeriodEscapements_Tot to
BasePeriodEscapements, and NonRetention_Tot to
NonRetention.
Run the calibration program. This will
updated ModelStockProportion in table
BasePeriodCatch. Before running the main (marked only)
calibration, rename the tables with the marked values to the original
table names. For more information visit sections
Fishery
Model Stock Proportion and
Instructions
for Producing a New Base Period.
Conducting a Run (generic)
Upon selecting the executable, the program opens to the Main Menu
also titled “Start Form”.
The user is presented with four run options.
Process only Out of Base Stocks When this option is selected the
program only processes OOB stocks. The user selects the database table
with the OOB Frambuilder recoveries. The program runs
OOB
procedures to the step where OOB recoveries are merged over brood
years. At this point the user has the option to provide brood year
weights. If no weights are provided each year receives the same
weight.
Selecting Update processes the new weights,
Cancelclears out updated weights, and
Closeuses the existing (not updated) weights. Please see
chapter
Merging
OOB CWTs over brood yearsfor more information about merging CWT
recoveries. After merging estimated CWT recoveries over brood years, the
program saves them in table CWTOOBMerged of the calibration
database.
Process Out of Base Stocks then All Stocks
This option
represents a typical calibration cycle that contains in-base as well as
OOB stocks. The program first processes OOB recoveries, before merging
them into the dataset with the in-base recoveries and conducting a
calibration as described in the
calibration
section of this documentation.
Process only All Stocks
If the calibration does not contain
OOB stocks, then this option will produce a complete base period without
running OOB procedures.
Cohort Reconstruction w/o expansions
Selecting this option
produces cohort reconstructions and base period exploitation rates
without escapement and fishery expansions; i.e., expansions are set to
1. Each stock can be processed independent of other
stocks as the program does not expand recoveries to match the
catch of all the stocks in a fishery. This procedure is akin to how the
CTC
conducts its exploitation rate analysis.
After selecting a run option the user presses the “Run” button. This
will open the file selection menu.
Select Open Support File. This brings up a file
explorer. Navigate to the directory with the calibration support
database, select, and press Open. You will be prompted to
select the table with the CWT recoveries for the desired run type.
The database table names and fields are loaded into the screen.
Select the table and hit Run.
While the program runs, it may provide several feedback messages. The
first message results from error check procedures. The program
eliminates CWT recoveries of stocks without a legal population size for
the age, fishery, and time step combination the recovery was made. The
warning message prompts the user to examine an output file, errfile.txt,
for more information about eliminated recoveries.
Another warning message occurs if catch is missing for a fishery and
time step that has actual or surrogate recoveries. Without catch, the
program cannot produce base period exploitation rates. A small catch
will remedy this situation and provide an exploitation rate without
greatly affecting cohort sizes. This situation can occur for
non-retention fisheries, where catch is illegal to retain, but BPERs are
desirable to model non-retention impacts. These fisheries are usually
modeled through the use of surrogate fisheries that provides the
necessary CWT recoveries.
A message is also produced for fisheries and time steps where base
period catch exists, but CWT recoveries are lacking. These are usually
fisheries that have designated surrogates. If this is not the case, a
surrogate needs to be introduced.
When the run has completed in returns to the main menu where the user
can exit the program or produce output for the newly created base
period.
Transferring Output
When selecting Export on the main menu screen, the
program transfers new base period output into a separate database used
to easily import the new base period into a FRAM database. At this
stage, model output is converted from a marked 39 stock structure to a
marked and unmarked 78 stock structure. Each stock is divided into an
unmarked (uneven stock ID) and a marked (even stock ID) component,
effectively doubling the number of stocks. The transfer function
re-numbers the stocks such that the new stock number equals old stock
number * 2 -1 for unmarked, and old stock number * 2 for marked. The new
unmarked cohort size is the same as the marked cohort size, thus
doubling cohort sizes. This is un-problematic as cohort sizes are
recomputed at the beginning of every FRAM run. All other variables that
have a stock-specific parameter (BPERs, growth functions, maturation
rates, etc.) are also doubled to have values for unmarked stock
components. The values are again recycled from the marked stock
components. This handling follows one of the main modeling assumptions;
that marked stock components are acceptable surrogates for unmarked
populations.
Select the name of an empty transfer database
The program prompts the user to select the calibration database
containing the base period data to be exported.
Select the desired base period and press
Transfer Selection Done.
The user is prompted to rename the transfer database.
Enter a new filename into the name field of the file dialog screen and
press
Save.
Importing Base Period Data Into FRAM
A new base period can be imported into a FRAM Access database by
selecting
FRAM Utilities on the
Main Menu.
Next choose
Get Base Period Transfer, select the transfer
database and press
Open.
This opens the following
window:
Fisheries and Time Steps are identical between the new and old base
period. However, there are differences in Base Period Size Limits and
Stocks. Check the boxes for “Base Period Size Limits” and “Stocks” to
also import this information, then select Done.
The
new base period will be added to the existing base period tables with a
new (incremented by 1) base period ID. When data import is completed the
“FRAM Utilities” page will reappear.
To ensure the import was
successful, it is good practice to check whether data exists for the new
BasePeriodID in the appropriate tables. The following tables include
data from the base period dataset:
Now there are just a few additional steps needed to update the
StockVersion and link runs to the newly imported base
period.
Retrieve the stock version number from FRAM’s database. This
number is located in the Stock table
StockVersion field.
Next, in the Access database, open
the BaseID table and identify the BasePeriodID
for the record that was just added (check the DateCreated
field for help). For this record, update the value in the
StockVersion field to the value from the Stock
table.
Open the RunID table. For any existing model
runs stored in the database that you wish to run with the new base
period data set, update the value in the BasePeriodID field
to the new BaseID.
Code Description
General Overview
The primary objective of the calibration program is to use externally
provided inputs, such as coded wire tag (CWT) recoveries, fishery catch
estimates, and incidental mortality rates, to calculate stock/age
specific exploitation rates for each FRAM fishery and time step. It is
important to note that the calibration program can be run on either the
“marked only” portion of a stock and catch, or on the “total” portion
(marked + unmarked) portion of a stock and catch. There are strengths
and weaknesses to each approach and more information is available on
this topic in the
Mass
Marking and Mark Selective Fisheries chapter. In general, “total”
runs are used to designate MSPs, whereas “marked only” runs are used to
calculate BPERs, base period cohort sizes, AEQ rates, and maturation
rates.
Program Flow
- Load Data:
After the calibration run is initialized, the
program proceeds to loading essential data from the
Calibration Support database.
- Error Check (ChDat):
- Impute CWT recoveries using surrogate fisheries and methods outlined
in
Addressing
Sparse or Missing CWT Recoveries according to instructions in the
ImputeRecoveries table.
- Eliminate CWT recoveries for stocks and ages within fishery/time
steps without a legal population size size (e.g., if all age 2s are
sublegal in a fishery, remove any age 2 recoveries from the fishery)
using the
CheckLeg.vb module.
- OOB Calculations:
OOB stock calculations are completed prior to
“all stock” calculations in the MainForm.vb module.
- Calculate escapements:
Escapement (defined as escapement +
freshwater sport catch + freshwater net catch) is calculated for each
OOB stock-age-time step combination within the CompEscape()
subroutine.
- Add catches:
AddCatch() is called to calculate OOB
catches using CWTs that have received sampling and brood year
expansions, but not fishery, escapement, or OOB expansions.
- Cohort reconstruction:
CompCohort() is called and
calculates a cohort using catch values that have not received fishery,
escapement, or OOB expansions.
- Calculate incidental mortalities:
An iterative process is
initiated, where IncMort(), CompCohort(), and
CohortCheck() are called several times until convergence is
achieved
- Calculate maturation rates:
MaturationRate() is
called to get maturation rates for OOB stocks within the OOB brood
years.
- Calculate exploitation rates:
ExploitationRate() is
called to compute exploitation rates for OOB stocks within the OOB brood
years.
- Compute simulated CWT recoveries:
The last module called to process OOB stocks is Forward().
It uses CWT recoveries in conjunction with fishery scalars from the out
of base years to simulate the number of CWT recoveries that would have
occurred given base period fishing effort. Fishery scalars used in this
calculation must be derived from post-season FRAM runs.
The Forward() module also ensures that OOB exploitation
rates do not exceed 100% and saves OOB exploitation rates to a list for
later use. A Forward Cohort reconstruction, starting with age-2 time
pre-fishing abundance and working forward through age-5 escapement, is
conducted in order to translate exploitation rates into simulated base
period CWT recoveries. After Forward() is complete a list
of OOB CWTs representing catches and escapements that have been adjusted
to the base period are saved in table CWTOOBMerged of the
calibration data base.
Note: Fishery scalars are computed
iteratively by providing calibration output parameters (base period
exploitation rates, maturation rates, etc.) to post-season FRAM runs.
The new base period exploitation rates will affect fishery scalars
(fishing effort) needed to achieve estimated post-season catches. The
new fishery scalars will in turn affect simulated CWT recoveries and
consequently base period exploitation rates, etc. Iterations are
terminated manually when fishery scalars vary no more than approximately
1% between iterations.
- “All Stocks” Calculations:
After the OOB calculations are
complete, computations for the “all stocks” run begin in the
MainForm.vb module.
- Merge OOB and in-base CWTS:
First, simulated OOB CWTs are
merged with base period CWTs.
- Calculate escapement expansions:
The program calculates
escapement expansions as the ratio of Observed Escapement to CWT
Escapement using the CompExpFact() subroutine. The
escapement expansion is applied to all CWT recoveries in order to
account for the entire stock, rather than just the CWT’ed
component.
- Add catches:
The Addcatch() subroutine is called,
which computes catch by stock/age/fishery/time step specific
subgroupings. The first call of Addcatch() is used to get
“Annual Catch”.
- Adjust catches:
The Adjcatch() subroutine is used
to get fishery expansion factors as the ratio of “Observed Catch” to
“Annual Catch”. Note that “Observed Catch” may be adjusted according to
the information provided in chapter
Fishery
Model Stock Proportion.
- Add catches:
Addcatch() is called again, to
calculate fisheries catch using CWTs that have all expansions applied
(sampling, brood year, escapement, fishery).
- Cohort reconstruction:
The CompCohort() subroutine
is called to calculate terminal and pre-terminal cohort sizes in a
process referred to as backwards cohort reconstruction – starting with
age-5 escapement and working backwards to age-2 pre-fishing
abundance.
- Calculate incidental mortalities:
See chapters
Estimating
Sublegal Mortalities and
Estimating
Non-Retention Mortalities about detailed calculations.
Incidental mortalities are computed in subrountine
IncMort() which calls subroutines
CompShakers() for sublegal mortality estimates and
CompCNR() for non-retention mortality estimates. As
sublegal mortality and fisheries catch computations are updated, the
cohort size must be updated. After the cohort size is updated, sublegal
mortality and fisheries catch must be updated. This necessitates
multiple iterations of this calculation loop to ensure accurate sublegal
mortality, and fishery catch results. During this iterative portion of
the calibration program a convergence criteria is used to terminate
calculations. First, catch is imputed for fishery-time steps that use
surrogate exploitation rates from the old base period. Next, incidental
mortalities within each fishery-time step are recalculated. The current
cohort is saved within the SaveCohort() subroutine so that
it can be compared to a newly calculated cohort later in the program.
Then, CompCohort() is called and recalculates the cohort
using new estimates of catch and incidental mortality. The
CohortCheck() subroutine is called, checking the newly
calculated age 2 cohort size for each stock and comparing them against
the cohort sizes saved prior to catch and incidental mortality updates.
If differences in age 2 cohorts across all stocks are less than a
specified allowable tolerance (the default tolerance is set at 1% within
the SummaryInfo table of the Calibration Support data base), then the
calibration program proceeds to the next step. If the difference is
greater than the allowable tolerance, the program loops back through the
processes described in this paragraph until tolerance thresholds are
met.
- Compute calibration output:
Subsequent to iterations, the main
calibration outputs such as AEQ values, maturation rates, base period
cohort sizes, MSPs, and BPERs are calculated in subroutine
SaveDat().
- Save output to calibration database:
Parameters from step 4g get
saved into their associated tables in the Calibration Support data base
within the “MainForm.vb” module.
Instructions for Producing a New Base Period (specific)
The following instructions are specific to the steps needed to
produce base period 7.1.
Compile and update data
Update all data needed for calibration and FRAM validation
databases.
Produce Validation Runs
Validation runs must be completed with the newest year first, going
backwards consecutively, because the 2s from 3s method designates
abundance values for 2 year olds for a given year based upon the
abundance values of 3 year olds in year + 1.
Normal Running Procedures
Open FRAM
Click the green Open Database button. Select the
desired validation run database and click Open. Select the
desired year to run.
Click the green Run Model button. Ensure that the
Size Limit Fix box is checked. Click the green
Run Model button
Click the green Post Season Run button. Edit the
number of iterations as you see fit (40 iterations is normally
acceptable, but always double check results). Click the green
Start Iterations button. Use TAMI Catches if this is your
first set of validation runs for the data base. Otherwise, do not use
TAMI catches.
After BKFRAM is complete (this process generally takes 1-5
minutes), complete the “BKFRAM Targets vs. Outputs” QAQC as described below. If there were no errors during BKFRAM QAQC,
continue to the next step. If there were errors, see the Errors section below.
Click the green Save Model Run Inputs button and on
the next screen click the green Replace Current Model Run
button.
Click the green Run Model button. Ensure that the
Size Limit Fix box is checked. Click the green
Run Model button.
Next, we must perform the age 2s from 3s procedure. If this is
the first (i.e., most recent) year in the validation runs, press the
green FRAM Utilities button. Press the green
Compute 2s From 3s (Chin) button. When the pop up appears,
click Yes. On the next pop up, click the green
Replace Current Model Run button. In the next window click
the green EXIT button. Proceed to the next step. If the
year you’re currently on is NOT the most recent year in validation runs,
age 2s from 3s should be calculated using the age 3 abundances from year
+1. We recommend using the supplied R code. See
“BY Age 2 from 3.R” for
more information. To use the code properly, make sure the file path and
name in code line 22 matches the location and name of the validation
data base. Also, ensure that the year in line 19 correctly matches the
year you’re on.
Click the green Run Model button. Ensure that the
Size Limit Fix box is checked. Click the green
Select TAMM button. Choose the TAMM associated with the
year being run. Click the green Run Model button. When the
pop up appears, click Yes to paste values into the
TAMM.
After the run is complete, open the TAMM on your task bar, and
navigate to the ER_ESC_Overview(ifanyMSF) tab. Check for ER
differences with the previous run in cells AC7:AF35. If ER differences
are minor (I usually aim for less than 5 thousandths of a percent in all
stocks), move to the next year (year = year - 1). If they are greater
than 5 thousandths of a percent, cells B7:E35 should be copied and
pasted into cells AH6:AK35. Then steps 4-10 should be repeated until ER
differences are less than 5 thousandths of a percent for all
stocks.
Implement additional TAMM procedures
- South Puget Sound Iterations
- North of Ayock/South of Ayock Splits
See
User
Manual for more information.
New Base Period Running Procedures
Complete steps above, but do not check size limit box.
QAQC
- Check BKFRAM Targets vs. Outputs
- Check 2s from 3s
- Check TAMM ERs vs. Last Iteration
Errors Encountered
The purpose of this section is to describe errors encountered during
post-season runs, potential causes, and potential solutions. This is an
incomplete list and it is possible to experience problems that differ
from those described below.
1.) Error message while conducting a forward run with TAMM
TAMM values not converging
This situation is typically caused by
a fish scalar of zero during a time with catch in the validation run
database/TAMM. To identify where the issue occurs, see the FRAMcheck.txt
file in the folder where the validation run database is located. By
scrolling through the text file, it is possible to identify the fishery
for which values do not converge. Once the fishery has been identified,
ensure that the fishery flags are correct in the validation run database
and that the scalar is not equal to 0 (for a fix set to 1).
2.) Terminal run size does not converge with the terminal run size
inputs during BKFRAM
This is typically caused by incorrect BKFRAM flags. For the stock
that does not converge, identify the stock ID in terms of its BKFRAM
stock ID. This is done by taking the stock number in the 39 stock format
and multiplying it by 3 (total; times 3+1 for unmarked; times 3+2 for
marked). For example, Willapa is stock 37 and becomes stocks 111-113 in
BKFRAM. Convergence issues can generally be fixed by changing the
BKtarget flag from a 3->1 within the validation run database. If the
flag is already a 1, and there are convergence issues, replace it with a
3.
